I hope previous blog “Arduino Basic Waveform Analysis Using an Ikascope” gives you the clear idea about the basics of the Ikalogic’s Ikascope. (For the First time Ikascope users kindly read the previous blog to know the features and to get started with the intelligent and wireless oscilloscope)
Let me not drag the blog more by repeating the features of Ikascope, So I will directly jump to the next experiment.
In this blog let us learn in-depth knowledge to analyze the Pulse width modulation using Arduino.
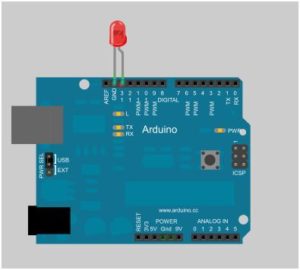
Hardware for the experiment is LED, 1K resistor, Arduino and miscellaneous. The experiment is all about controlling the brightness of LED using Pulse width modulation (PWM) concept.

Follow the kickstart procedure to turn on the Ikascope and connect with the display device. Set up the simple LED connection with Arduino. Write Simple code by using PWM pin, analogWrite() value (From 0 to 255) to get different duty cycle 25% Duty cycle, 50% Duty cycle, 75% Duty cycle and 100% Duty cycle.
The Arduino has three TIMERS i.e TIMER0, TIMER1, TIMER2 and each timer is connected with two pins. The documented frequency from each pin of Arduino (https://www.arduino.cc/en/Tutorial/SecretsOfArduinoPWM) is described in the below table.
| TIMERS | Pins Controlled | Frequancy |
| Timer0 | 5 & 6 | 960 Hz |
| Timer1 | 9 & 10 | 490Hz |
| Timer2 | 11 & 3 | 490Hz |
Now let us verify predefined frequency rates for individual PWM pins of the Arduino using Ikascope.
The below screenshot provides the information of PWM 9 & 10 pins of Arduino and matches the Arduino documental frequency as 490 Hz (The waveform of 25% Duty cycle 50% Duty cycle and 75% Duty cycle )


The below screenshot provides the information on PWM 11 & 3pins of Arduino and matches the Arduino documental frequency as 490 Hz (The waveform of 50% Duty cycle and 75% Duty cycle )


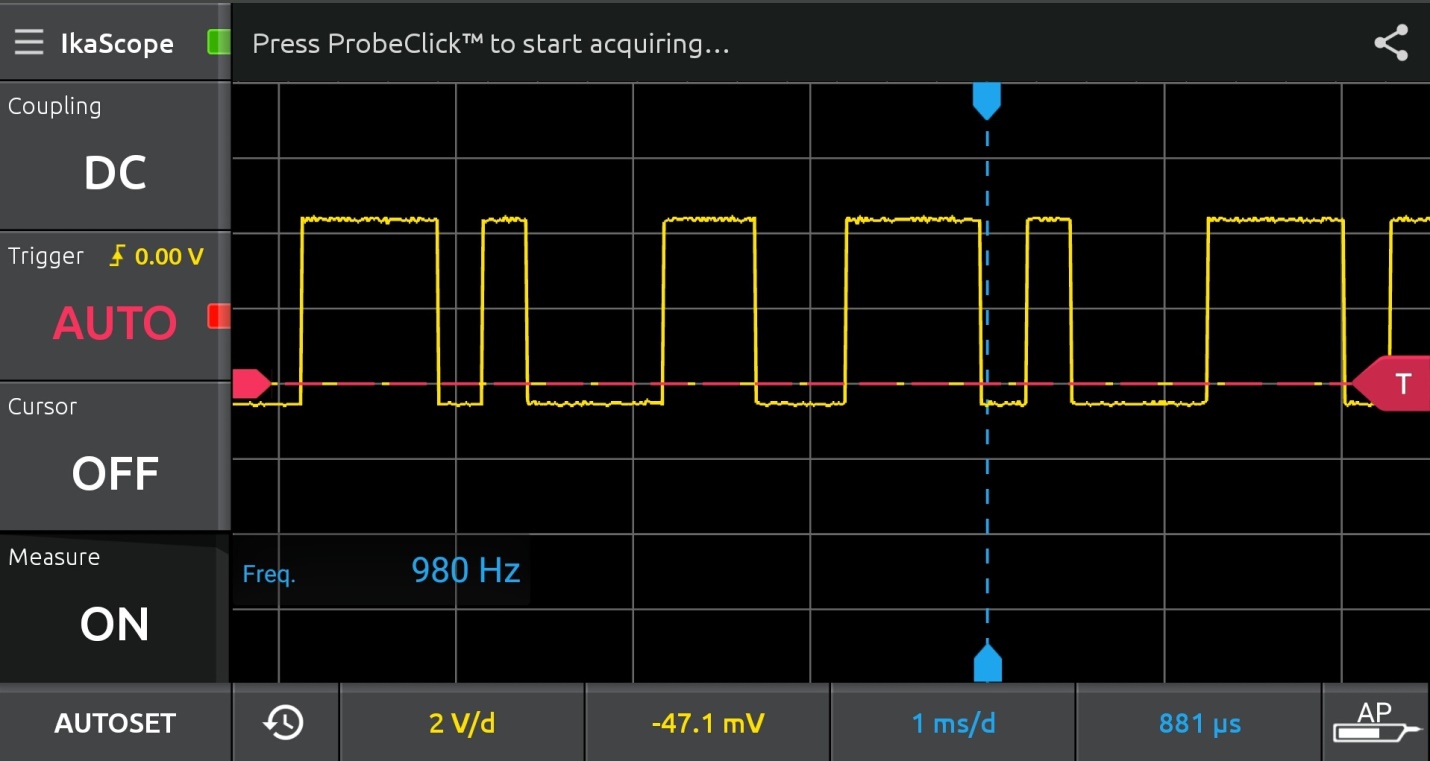
The below screenshot provides the information of PWM 5 & 6 pins of Arduino and matches the Arduino documental frequency as 490 Hz (The waveform of 25% Duty cycle and 75% Duty cycle )


The different duty cycle i.e 25 %, 50% and 75% duty cycle as shown below picture captured from the Ikalogic’s Ikascope.

By concluding this blog, we can conveniently measure the PWM signals more accurately using the additional features of IKascope.


